Project 3: Producing Terrain Elevation Data with LIDAR
By Luminita Slevoaca
Introduction
For Project 3, I chose the following theme “Producing Terrain Elevation Data with Lidar”. In my project I will present how a lidar system works, various types of lidar, how lidar data is georeferenced and make a comparison between lidar derived DEM and USGS DEM. I will also present a case study that used lidar technology to account for the ongoing topographic changes at Mount St. Helens.
What is Lidar?
Lidar is an acronym for Light Detection And Ranging. Airborne laser scanning systems developed by the U.S. government have been in use since the early 1970s. Their specific application was to measure accurately the height of the aircraft over the Earth’s surface with a single pulse. From the early days, laser scanning systems were recognized as valuable surveying tools. A major improvement of lidar systems came in the late 1980s with the development of GPS technology that provided positioning accuracy, followed by the development of rapid pulsing scanners a few years later. Ultra-accurate clocks and the Inertial Navigation System (INS) completed the lidar systems. (Renslow, 2001)
Lidar functions on the following principle: it sends laser pulses to a remote target and calculates the distance to the target by measuring the time delay between when the signal was emitted and when the signal was received. Lidar’s functioning concept can be expressed mathematically this way:
Distance to the remote target = speed x time,
In this equation, speed represents the speed of light and it is constant.(Evans,2006)
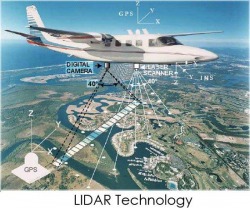
Figure 1. Lidar system. Copyright VISIONLABS Photogrammetry.(2009) Used here for educational purpose only.
A lidar system is generally mounted on a small aircraft and measures “the 3D coordinates features from reflection (or echo) on the earth's surface”. (Renslow, 2001)
Using the above image representing a lidar system, I will explain how the main components of the system work. While the aircraft flies over an area of interest, the laser scanner emits thousands of pulses per second to the Earth’s surface, which are reflected back to the aircraft. A receiver will capture the return pulses and a precision clock will determine the travel time of the pulses. Since we can measure the travel time, the distance to an object can be calculated by applying the mathematical equation from above, distance to an object equals the speed multiplied by travel time. The GPS system determines accurate coordinates for the aircraft’s position, while the INS system records the orientation of the lidar’s platform during pulse firing. Another major component is the on-board computer that records the information from all the systems and sensors, and then converts the return pulses into millions of x, y, z coordinate points. The x, y, z coordinate points are the primary lidar data and referred to as “point cloud” data. (Renslow, 2001)
Using the above image representing a lidar system, I will explain how the main components of the system work. While the aircraft flies over an area of interest, the laser scanner emits thousands of pulses per second to the Earth’s surface, which are reflected back to the aircraft. A receiver will capture the return pulses and a precision clock will determine the travel time of the pulses. Since we can measure the travel time, the distance to an object can be calculated by applying the mathematical equation from above, distance to an object equals the speed multiplied by travel time. The GPS system determines accurate coordinates for the aircraft’s position, while the INS system records the orientation of the lidar’s platform during pulse firing. Another major component is the on-board computer that records the information from all the systems and sensors, and then converts the return pulses into millions of x, y, z coordinate points. The x, y, z coordinate points are the primary lidar data and referred to as “point cloud” data. (Renslow, 2001)
Types of LIDAR
There are a variety of lidar sensors that perform many different functions. In this section, I will present the differences in lidar platforms, laser sensors, types of pulse returns, size of the laser footprint and different application based lidar systems.
There are three main types of platforms for lidar systems, space-based, ground-based and airborne. Space based systems involve the use of satellites like ICESAT. Ground based systems consist of mounted tripod receivers. The most common platform is airborne, which utilizes small aircraft to carry the lidar system.
There are two different types of lidar systems that rely on different laser sensors. A profile system uses a laser that is fixed to the aircraft and collects only the return pulses from underneath the aircraft. The laser sensor used for the scanning systems, the most common type of commercial lidar, uses a mirror to direct the pulses. This makes it possible to collect more points of data and allows for overlapping flight lines that are useful in correcting systematic errors.
Lidar systems can have three types of return pulses, single, multiple, and waveform. Single return systems simply return the pulse on the first occurrence of an object. Multiple returns systems record multiple x, y, z coordinates for each pulse return. The image below is an example of a multiple return system. As we can notice, when the pulse reaches the top of the tree it will generate the 1st return. Several others returns can be generated until it reaches the ground, also known as the last return.
Waveform return systems are a new technology used for research only by NASA. Waveform pulses return a constant stream of data in the form of energy returned per pulse. (Stocker, 2005)

Figure 2. Multiple returns of a lidar pulse. Copyright University of Idaho. (2006) Used here for educational purpose only.
The lidar footprint refers to the diameter of the laser pulse when it reaches a target point. Depending on the size of the diameter, lidar systems can be classified as large footprint or small footprint. The image below exemplifies these types of lidar systems.
 a. Large footprint lidar system |
 b. Small footprint lidar system |
Figure 3 a. Large footprint lidar system, Figure 3 b. Small footprint lidar system.Copyright Jason Stoker(2005.) Used here for educational purpose only
The pulses produced by large footprints lidar systems have a diameter of approximately of 10 to 25 meters. Small footprint lidar pulses cover a diameter of 0.5 to 1m. Small footprint systems produce a higher resolution point cloud. Most commercial lidar systems are small footprint systems and are able to receive multiple returns from pulses.
Based on their use there are three basic types of lidar systems: range finders, Differential Absorption lidar (DIAL) and doppler lidar. (Mark, 2004)
Range finder lidar systems are used to measure the distance from the lidar sensor to a particular object. Thesesystems are capable of recording multiple returns and used to create 3D models of the Earth’s surface. These systems are the most common type of lidar used to create data for GIS analysis
DIAL lidar is used to measure the chemical composition of atmospheric gases. A DIAL system will send two pulses and one pulse will be absorbed by the atmospheric gas while the other pulse is not. The concentration of the atmospheric gas can be calculated from the difference in the intensity of the two pulses.
Doppler lidar systemsare used to measure the speed of an object. A Doppler system will emit a pulse towards a moving object and will measurethe slight change of the wavelength that is reflected back from the moving object.
Processing LIDAR data
We established in a previous section that the primary lidar data product is the point cloud. While the point cloud associated to an object can make sense to the human eye it needs to be processed in order to be used for analysis. The point cloud data is stored in a text or binary (LAS) format. An area of 2kmx2km (approximately 990 acres) that has 3 to 4 points per m2 will produce a file that contains 9 to 12 million points. (Nayegandhi, 2007)
In order to process the lidar data, the following steps are applied:
§ Point cloud data – the processing starts with the raw lidar data
§ Sorting, merging and filtering – in this step erroneous points generated by return pulses from features such as birds, atmospheric dust, bright objects are eliminated. Also in this step, surface features are classified as vegetation, buildings, ground etc.
§ Coordinate/ Datum Conversion – the initial output is presented in the WGS84 coordinate system and can be converted to different coordinates systems according to the user’s needs.
§ Rasterizing – the point data is first transformed into a TIN (Triangulated Irregular Network), the points are connected into triangles. The TIN is then transformed into a grid or raster surface. The grid data is known as adigital elevation model (DEM). (Nayegandhi, 2007
The processed data can result in different outputs: canopy-top elevations obtained from the first return pulses, bare-earth elevations obtained after the non-ground points have been removed, building models, vegetation metrics and intensity images. (Nayegandhi, 2007)
How is LIDAR data georefrenced?
The point cloud data generated by the lidar system is directly georeferenced, meaning that the coordinates for each laser pulse depend on the instantaneous information provided by the GPS and INS systems. The GPS system accounts for the positions of the laser spot on the ground, while the INS accounts for the orientation of the sensor. Since the point data is georeferenced by the GPS system it will presented in the WGS84 coordinate system. The data is usually converted to the NAD83 datum, based on the GRS80 ellipsoid. Due to this transformation the horizontal offset between WGS84 and GRS80 is minimal but the vertical offset can exceed 1m. (Nayegandhi, 2007) The lidar data can be further compared with ground surveyed control points to test its accuracy. Most of the systematic errors that can be detected areusually caused by the calibration of the lidar sensors.
Topographic LIDAR
There are two types of lidar systems used for mapping. Topographic systems areused to measure surface elevations and bathymetric systems measure the sea floor and submerged objects. One important advantage that lidar technology presents is producing highly accurate elevation data. This is why in this section I will discuss about the topographic system.
Topographic lidar is a range system that measures the distance from the sensor to a particular object recording multiple pulse returns. Most topographic lidar systems use near-infrared laser wavelengths (1064 nano-meters), which aresafe to the human eye andreflect well from vegetation and bare-earth. (Renslow, 2001)
According to Airborne 1 Corporation website, a commercial lidar data company, aircrafts equipped with thislidar system are flying at speeds of50-200 knots and at heights of between 100 and 5,000 meters. The laser scanner emits pulses at a rate of 2,000 to more than 100,000 pulses per second at a scanning angle of over 20 degrees. Airborne 1 claims that using the lidar technology at these specifications produces digital terrain models with an accuracy of 15 centimeters at up to 95 percent confidence interval vertically and 1 foot or 30 centimeters horizontally. Renslow (2001) makes the clarification that topographic lidar systems can provide a vertical accuracy of 15 cm when the laser pulse hits a clear surface like roads, buildings. The same accuracy cannot be obtained for dense vegetation areas where the vertical accuracy willbe dependent on the number of pulses that reach the ground.
The main advantage of the topographic lidar is that is able to produce highly accurate DEM files faster which can be used for various analysis.
Comparison between LIDAR derived DEM and USGS DEM
In this section I will make a comparison between lidar derived DEM and USGS DEM. USGS DEM (Digital Elevation Model) files are digital representations of elevation values in a raster format. (USGS,2009). USGS DEM are available at three scales: large ( 7.5-minute and 15-minute), intermediate (30 minute) and small scale (1 degree). Small scale DEM files with a resolution of 30 meters are available for the entire U.S. Large scale DEM files with a resolution of 10 meters are available for most of theU.S.(DiBiase,2009). Large scale DEM files are derived from contour map overlays or from scanned ortophotos produced by National Aerial Photography Program (NAPP) and have a vertical accuracy equal to 15 meters or better.(USGS,2009)
Lidar derived DEM files are generated by specialized software from point cloud data and present several advantages over USGS DEM. Lidar DEM files can provide a vertical accuracy 5 – 15cm and a horizontal accuracy of 30 – 50 cm, which represents a major improvement by comparison with USGS DEM files. (Lohani,2009)
Lidar DEM files, like USGS DEM, are raster files. Lidar DEM files though, have a smaller grid spacing and they permit a higher density of elevations measured, which results in higher resolution. New lidar sensors can emit up 167,000 pulses per second, this makes itpossible to measure more than 24 points per square meter. (Lohani,2009). Because lidar DEM files record a high density data they have the inconvenience of occupying more digital storage than USGS DEM files. To emphasize the difference in detail provided by high resolution lidar DEM, I will compare a shaded relief view of Bainbridge Island, WA at a 10-m resolution DEM and at 12-ft lidar DEM.
 a. Image of 10-meter DEM |
 b. Image of 12-ft LIDAR DEM |
Figure 4 a. Image of 10-meter DEM derived from 1:24,000-scale contour map, Figure 3 b.Image of 12-ft LIDAR DEM.Copyright Puget Sound Lidar Consortium (2008.) Used here for educational purpose only
Figure 4a represents a 10-m resolution USGS and is derived from a 1:24,000-scale topographic map. A 10 meter resolution means that the image is organized in a grid pattern with a 10-meter spacing. Figure 4b represents lidar DEM with a 12 feet (approx. 3.65m) spacing, making itpossible to provide the added detail.
As mentioned above, large scale USGS DEM files are available for the entire U.S. but for certain projects this scale may not be detailed enough. An alternative are the highly accurate lidar DEM files. Lidar DEM can be produced fast to meet particular projects needs. A lidar DEM that covers a surface of a 1000 square km can be produced in 24 hours, while the acquisition for this surface can be achieved in 12 hours. (Lohani,2009)
USGS DEM files can provide only bare ground values. Lidar DEM files are derived from point cloud data, which are returned pulses from various features above the earth’s surface. Since the point cloud data is formed from intermediate elevation, lidar DEM can provide 3D models of the earth’s surface. In order to create bare ground lidar DEM files, features like vegetation or buildings need to be removed from the point cloud and this is a time-consuming and costly process.
All these advantages that lidar DEM files present over USGS DEM files come at a cost. According to National Oceanic and Atmospheric Administration (NOAA) webpage, the average cost for producing point cloud lidar data in 2009 is approximately $1,000 to $2,000 per square mile for 2 to 3-meter postings and the cost does not include derived products like DEM andcontours.
Even though lidar data is expensive, its accuracy makes it an invaluable technology. Recognizing it as an effective mapping technology, USGS created the CLICK (Center for LIDAR Information Coordination and Knowledge) portal that provides ‘free of charge’ lidar data to users. Since lidar data covered by USGS is limited, CLICK includes lidar data from LidarData.com at cost. There are a few others governmental agencies that allow free download or request of lidar data: North Carolina Flood Mapping Program, The Louisiana Statewide GIS Atlas, NOAA Coastal Services Center. (NOAA, 2009)
Case study LIDAR: monitoring Mount St. Helens
Mount St. Helens is an active volcano situated in Skamania County, Washington. It is famous for producing the most devastating volcanic event in the history of United States when it erupted in May 18, 1980. (Wikipedia,2009) The volcanic activity of Mt. St. Helens and its continuously changing surface has been studied by scientists.
In September 2003, USGS contracted Earth Data International to perform lidar data acquisition and processing of Mt. St. Helens. The accurate, high resolution lidar derived DEM are useful to scientists to account for topographic changes and to monitor seismic activity. The specifications for the bare ground DEM were: a ground sample point spacing of no more than 5 meters, a horizontal accuracy of 2 meters and a vertical accuracy of 18 centimeters. Due to its importance in the research of volcanic-hazard activities, lidar produced data was checked for quality against more than 500 control points obtained through GPS ground survey methods. The quality assessment established a root-mean-square (rms) vertical accuracy of less than 18 centimeters for the Mount St. Helens lidar dataset. (Queija et al, 2005)
In September 2004, USGS and NASA were planning a second survey of Mt. St. Helens. Seismic activity that began on September 23rd accelerated their plans and they contracted TerraPoint to perform a lidar survey on October 4th, 2004. The 2004 survey shows the volcano deformation and accounts for the crater elevation changes. The 2004 lidar data, shows that the new uplift formed in the volcano’s crater grew to the height of a 35-story building (110 meters or 360 feet) and the area of 29 football fields (130,000 square meters) in only two weeks. (NASA, 2004) To study the growth of the new uplift, additional lidar datasets, including those obtained on September 24, September 30, and October 14, 2004, by Sky Research, were used.(Queija et al, 2005)
To visualize the topographic changes due to volcanic unrest, I will present lidar derived shaded relief images of Mt. St. Helens from September 2003 through November 20th, 2004.


Figure 5. Topographic changes of the new dome area Mount St. Helens crate from September 2003 through November 2004 . Copyright USGS/Cascades Volcano Observatory (2004.) Used here for educational purpose only
This is the first time lidar technology was used to measure a volcanic deformation. The Lidar derived DEM of the topographic changes at Mt. St. Helens preset valuable information to the research scientist that will aid in analysis and future forecasting. Linda Mark, a hydrologist with the USGS Cascades Volcano Observatory, assesses the role played by the lidar dataset in the monitoring of the Mt. St. Helens. "Global Positioning System data provide us with very accurate point measurements of deformation, but only at locations where we can place an instrument. LIDAR, however, helps us quantify the ongoing deformation in the crater of Mount St. Helens with lesser accuracy but over a much broader area. Used together, the two methods complement each other, and the LIDAR-derived DEMs can be used for modeling efforts to help forecast volcanic hazards", she concluded. (NASA, 2004)
Conclusion
Lidar is valuable remote sensing technology that has uses in various fields. It is a flexible technology that allows for different types of sensors, footprints, pulses that can be delivered using many different platforms. Lidar technology has proven to be an efficient mapping tool that has the ability to produce accurate elevation measurements, it can measure multiple surfaces simultaneously that can generate different types of data output and can produce high resolution DEM fast. Lidar DEM files have many advantages over USGS DEM, although you pay for the advantages. A real world example like Mt. St. Helens shows the detail that it can provide and a timely manner that was previously unattainable, providing scientists with valuable information in their research.
Sources
Ackermann, Friedrich (1999), Airborne laser scanning present status and future expectations. ISPRS Journal of Photogrammetry & Remote Sensing, Vol. 54. Retrieved December 1, 2009
Airborne 1 Corporation (2009), How LIDAR works, Retrieved December 1, 2009
DiBiase, David(2009). The Nature of Geographic Information, Retrieved December 14, 2009
Evans, Jeffrey S.(USDA Forest Service),(2006). Introduction to Discrete Return Lidar. Retrieved December 1, 2009
Lohani, Bharat(2009). Lidar Tutorial. Retrieved December 14, 2009
Louisiana Statewide GIS Atlas (2009). Retrieved December 15,2009
Mark, Linda (2004), USGS/Cascades Volcano Observatory -http://vulcan.wr.usgs.gov/Monitoring/LIDAR/description_LIDAR.html. Retrieved December 7, 2009
National Oceanic and Atmospheric Administration (NOAA) - Remote Sensing for Coastal Management – LIDAR. Retrieved December 14, 2009
Nayegandhi, Amar (2007). Lidar Technology Overview. Retrieved December 5, 2009
North Carolina Flood Mapping Program (2009). Retrieved December 15, 2009
Quejia, Vivian, Stoker, Jason and Kosovich, John (2005).Recent U.S. Geological Application of Lidar. Retrieved December 14, 2009
Renslow, Michael S. (2001). Predicting NW Forest Stand Structural Characteristics Using Multi-Return LIDAR.Retrieved December 1, 2009
Stoker, Jason (2005). MAGIC/USGS Lidar Workshop – Lidar 101: The who’s, what’s, and why’s. Retrieved December 7, 2009
USGS (2009). CLICK (Center for LIDAR Information Coordination and Knowledge).Retrieved December 14, 2009
USGS (2009). Digital Elevation Model (DEM). Retrieved December 14, 2009
Wikipedia - Mount St. Helens Entry.Retrieved December 14, 2009
Page updated December 15, 2009